| Columns Retired Columns & Blogs |

typo
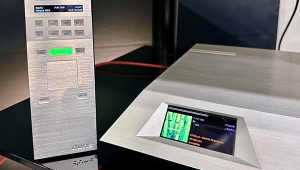
Before measuring the Cambridge MXN10 with my Audio Precision SYS2722, I installed the StreamMagic app on my iPad mini. After the Cambridge's Ethernet port had been connected to my network, I used the app to perform a factory reset and check that the firmware was up to date. I measured the Cambridge using test-tone files stored on a USB stick plugged into the processor's rear panel or via my network with Roon. (The Cambridge is a Roon Ready device.) TF told me that he auditioned the Cambridge with its output level set to Fixed, so all the testing was performed in that mode. I then used the app to enable Preamplifier mode and repeated some of the tests at various volume control settings. (The StreamMagic app's volume setting was echoed by the Roon app.)
In both Fixed mode and in Preamplifier mode with the volume control set to the maximum of "100," the MXN10's maximum output level at 1kHz was 2.1V into 100k ohms. The app's volume control operated in 0.75dB steps—a setting of "80" reduced the analog output level by 15dB. (The volume control doesn't affect the output level at the S/PDIF digital outputs.) The MXN10's single-ended output preserved absolute polarity (ie, was noninverting), and the output impedance was a moderately low 437 ohms from 20Hz to 20kHz.


Fig.1 shows the MXN10's impulse response with 44.1kHz data. The reconstruction filter appears to be a long minimum-phase filter, with all the ringing following the single full-scale sample. This filter's ultrasonic rolloff (fig.2, magenta and red traces) reaches full stop-band attenuation at 24kHz with the aliased image at 25kHz of a full-scale tone at 19.1kHz (cyan, blue) suppressed by 87dB. The harmonics associated with the 19.1kHz tone all lie below –96dB (0.0015%). Fig.3 shows the MXN10's frequency response with data sampled at 44.1, 96, and 192kHz. The response with all three sample rates is down by <0.1dB at the top of the audioband, with then a sharp rolloff just below half of the sample rates. The response with 192kHz data continued the relatively gentle ultrasonic rolloff, reaching –3dB at 90kHz.

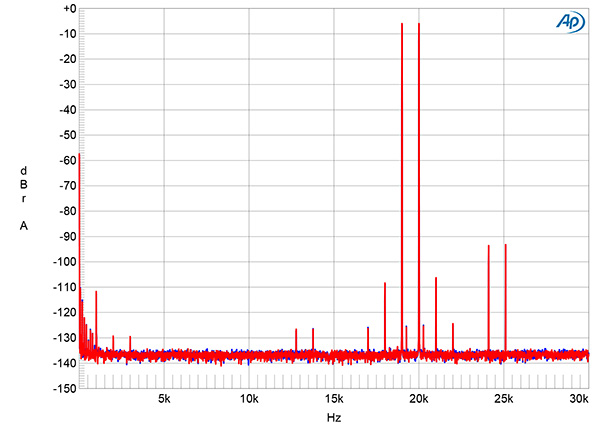
Channel separation was superb, at >103dB in both directions below 2kHz, and was still 96dB at 20kHz. Fig.4 shows the spectrum of the MXN10's low-frequency noisefloor as it drove a full-scale 1kHz tone. The level of the random noise is extremely low and while some AC supply-related spuriae are present, these all lie at or below –114dB. As the frequencies of these spuriae are 60Hz and its odd-order harmonics, they are probably due to magnetic interference from the power transformer.


An increase in bit depth from 16 to 24, with dithered data representing a 1kHz tone at –90dBFS, dropped the MXN10's noisefloor by >20dB (fig.5), which implies a resolution of almost 20 bits. This is superb performance for such an inexpensive D/A processor. Repeating this test in Preamplifier mode with the volume control set to –20dB didn't significantly reduce the resolution. When I played undithered data representing a tone at exactly –90.31dBFS, the waveform was symmetrical, with negligible DC offset, and the three DC voltage levels described by the data were relatively free from noise (fig.6).

As seen in fig.2, the MXN10 produced very low levels of harmonic distortion with full-scale data (fig.7). The subjectively benign second and third harmonics were the highest in level, but each lay below –100dB (0.001%). Intermodulation distortion with an equal mix of 19 and 20kHz tones at –6dBFS was similarly extremely low, even into the punishing 600 ohm load (fig.8). All the intermodulation products lay at or below –107dB, which is lower than the levels of the aliasing products at 24.1kHz and 25.1kHz!
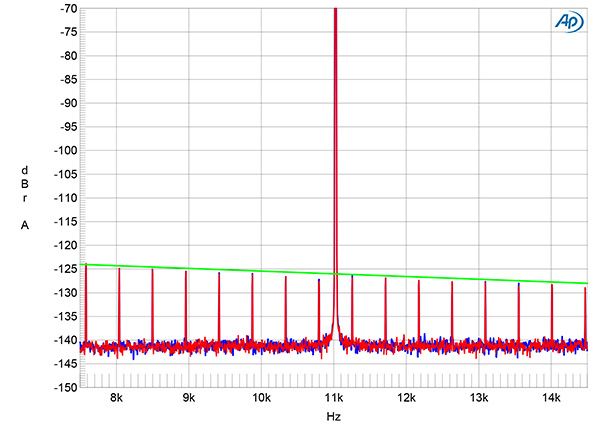

Fig.9 shows the spectrum of the MXN10's output when it was fed high-level 16-bit J-Test data via my network. The same data played back from the USB stick gave an identical result. All the odd-order harmonics of the undithered low-frequency, LSB-level squarewave lie at the correct levels, and no other sideband pairs are visible. Commendably, the central spike that represents the high-level tone at one-quarter the sample rate (Fs/4) isn't broadened at its base. Repeating this test with 24-bit data gave a similarly superb spectrum (fig.10).

Finally, I examined the quality of the optical and coaxial S/PDIF outputs. Both operated with data sampled at rates up to 192kHz, and the datastream was clean, with a wide-open eye pattern, plotted over one "unit cycle" with 44.1kHz data (fig.11). The average jitter level, assessed with a 50Hz–100kHz bandwidth, was a low 389 picoseconds (ps) from the optical output and 340.5ps from the coaxial output. (The latter is identical to what I measured when I looped the Audio Precision SYS2722's S/PDIF output to its coaxial input.)
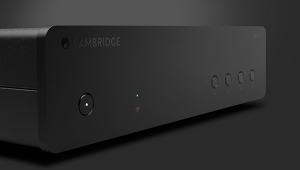
Cambridge's MXN10 offered superb performance on the test bench, considering not only its very affordable price but also the fact that the circuitry and power supply are housed in a small chassis. The latter makes it difficult for the designer to avoid interference and maximize resolution. That the MXN10 performs as well as it does suggests that Cambridge Audio has some serious engineering talent in-house.—John Atkinson
|
|
| ||||||||||


| Loudspeakers Amplification Digital Sources | Analog Sources Accessories Featured | Music Columns Retired Columns | Show Reports | Features Latest News Community | Resources Subscriptions |
 © 2024 Stereophile